Weather updates:
The types of maps:
It is important to have scales, compass, and a key on your maps.
Chloropleth: maps that use different colors to differentiate between areas of various distinctions. It may be used to show the amount of rainfall in certain areas, or the types of climate as shown in the image to the right. The many uses of chloropleth maps are useful for weather forecasts, population, or anything that needs to show a difference between 2 or more locations.
Dot density: typically used for population of a specific variable, such
as the poor or those who use solar power in their homes. The placement
of the dots within the boundaries of each state or country is
irrelevant, because it is calculating the total for the total area.
Proportional Symbol: marker is related to size of value.
For example, it can also be used for population. They
are especially designed to show a particular theme
connected with a specific geographic area.

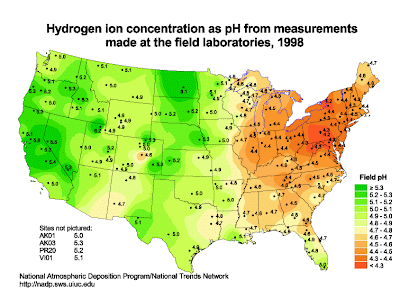
Isopleth:
An isopleth map generalizes and simplifies data with a continuous distribution. It shows
the data as a third
dimension on a map, thus isopleth maps are more common for mapping surface elevations,
amounts of
precipitation, atmospheric pressure, and numerous other measurements that can be viewed
statistically as a third
dimension.
The third dimension is shown by a series of lines called isopleths which connect points of
equal value. The
isopleth interval is the difference in value between two adjacent isopleths. Note, the values of the
isopleths drawn
on the map are
ALWAYS multiples of the interval. Isopleths never
cross or divide and always form enclosed
circles, however, this occurrence may not be in the mapped area.
Source:
http://www.aegis.jsu.edu/mhill/phygeogone/isoplth.html
Topographic/bathometric: these maps denote height or depth, such as mountainous regions and the various levels of steepness. The lines help show the shape of the land, and the values show how drastically the height has changed.


